Bowdens Silver Project
The Bowdens Silver Project is the largest known undeveloped silver deposit in Australia with substantial resources. A considerable body of high quality technical work has been completed. The Project boasts outstanding logistics for future mine development.
In June 2018, the Company and its consultants completed a Feasibility Study comprising a single open-cut mine with an initial mine life of 16 years. The Study is based on a maiden Ore Reserve of 29.9 million tonnes at 69.0 g/t silver, 0.44% zinc and 0.32% lead. A new processing plant designed to process 2.0 million tonnes per annum would include a conventional SAG and ball mill circuit, differential flotation, thickening and dewatering to produce two concentrates that will be sold for smelting and refining to finished metals. The Feasibility Study has demonstrated that the Project will produce an average of 3.4 million ounces of silver per annum, together with approximately 6,900 tonnes of zinc and 5,100 tonnes of lead per annum. Due to higher silver grades in the early stages of mining, average production during the first three years of operation will be approximately 5.4 million ounces of silver per annum and 6,000 tonnes of zinc per annum and 5,200 tonnes of lead per annum.
The Feasibility Study was managed by GR Engineering Services Limited (GR Engineering), an experienced and prominent engineering consultancy with appropriate processing and study management experience globally including substantial experience in silver and base metals.
A Mining Lease application will be lodged in conjunction with the Development Application (DA) and Environmental Impact Statement (EIS).
Feasibility Study Summary
The Bowdens Silver Project is located approximately 26 kilometres east of Mudgee in the Central Tablelands Region of New South Wales and approximately 260 kilometres by road from the State capital, Sydney.
The Project lies within Exploration License 5920 which is wholly owned by the Company. A Mining Lease application will be lodged in conjunction with the Development Application (DA) and Environmental Impact Statement (EIS).
The Project contains a JORC Measured, Indicated and Inferred Resources of 128 Million tonnes at 40 g/t silver, 0.38% zinc and 0.26% lead using a 30 g/t Ag Eq cut-off grade, equivalent to 275 million ounces Ag Eq (Refer to ASX Announcement 19 September 2017). The Company recently announced a maiden Proven and Probable Ore Reserve of 29.9 Million tonnes at 69.0 g/t silver, 0.44% zinc and 0.32% lead. (Refer ASX Announcement 30 May 2018).
The Project comprises a single open-cut mine, developed in six stages feeding a new processing plant comprising conventional SAG and ball mill circuit, (SAB), differential flotation, thickening and dewatering to produce two concentrates that will be sold for smelting and refining to finished metals (see figure below). Plant capacity is designed for 2.0 million tonnes per annum and the open-cut mine has an initial life of 16 years.
The Feasibility Study has demonstrated that the Project will produce an average of 3.4 million ounces of silver per annum, together with approximately 6900 tonnes of zinc and 5100 tonnes of lead per annum. Due to higher silver grades in the early stages of mining, average production during the first three years of operation will be approximately 5.4 million ounces of silver per annum and 6000 tonnes of zinc per annum and 5200 tonnes of lead per annum.
Initial capital costs are estimated at A$246.0 million including mine development, processing plant, Tailings Storage Facility (TSF) and power supply with a further A$53.9 million expended over the LOM in sustaining capital.

Mine Site Layout
Location, Ownership and Tenure
The Bowdens Mine Site is located approximately 26 kilometres east of Mudgee in the Central Tablelands Region of New South Wales and approximately 260 kilometres by road from the State capital, Sydney.
![]() Project Location and Tenements
Project Location and Tenements
The Project is located within Exploration Licence 5920 which is wholly owned by Bowdens Silver Pty Ltd (BSPL), a wholly-owned subsidiary of the Company. The License covers some 9,244 hectares.
The majority of freehold land within the Project area is owned by the Company. BSPL also holds freehold title to several land parcels that border the Project Mine Site. These properties comprise large-lot residential holdings and agricultural farms.
There are no Mining Leases currently associated with the Bowdens Silver Project. A Mining Lease application will be lodged in conjunction with the Development Application (DA) and Environmental Impact Statement (EIS).
Bowdens Feasibility Study – Study Team
The Feasibility Study was undertaken under the management of GR Engineering Services Ltd (GR Engineering), a globally experienced process engineering and construction company based in Perth, Western Australia. GR Engineering have managed many similar studies in the past and constructed similar plants.
GR Engineering were supported in the study by several other nationally and internationally experienced consultants who undertook various specialist studies. Contributors to the Feasibility Study are provided in the table below.
Bowdens Silver Feasibility Study Team
| Specialist Consultant | Study Area |
| GR Engineering Services Ltd | Overall Study Management, Metallurgical Testwork Analysis, Process Design, Engineering Design |
| AMC Consultants Pty Ltd | Geotechnical Assessment, Metallurgical Testwork Management, Ore Reserve Estimation, Mine Design and Scheduling |
| ATC Williams Pty Ltd | Tailings Storage Facility Design |
| Jacobs Group (Australia) Pty Ltd | Hydrogeological Investigations and Modelling |
| RW Corkery & Co Pty Limited | Environmental and Social Impact |
| H & S Consultants Pty Ltd | Resource Estimation |
| Barnson Pty Ltd | Road and Site Access |
| Energy Management Services Pty Limited | Power Supply |
| Bill Cunningham & Associates Pty Ltd | Product Marketing and Logistics |
| Northshore Capital Advisors Pty Ltd | Financial Analysis |
Geology
The Bowdens Silver Deposit is hosted by the Early Permian silicic and felsic Rylstone Volcanics on the north eastern flank of the exposed Lachlan Fold Belt. These volcanics overlie the eastern flank of the north-northeast trending Northern Capertee Rise. The Northern Capertee Rise comprises an anticlinorium cored by Ordovician basement overlain by Silurian and Devonian shallow marine to subaerial volcanics and sediments which are intruded by Carboniferous granites.
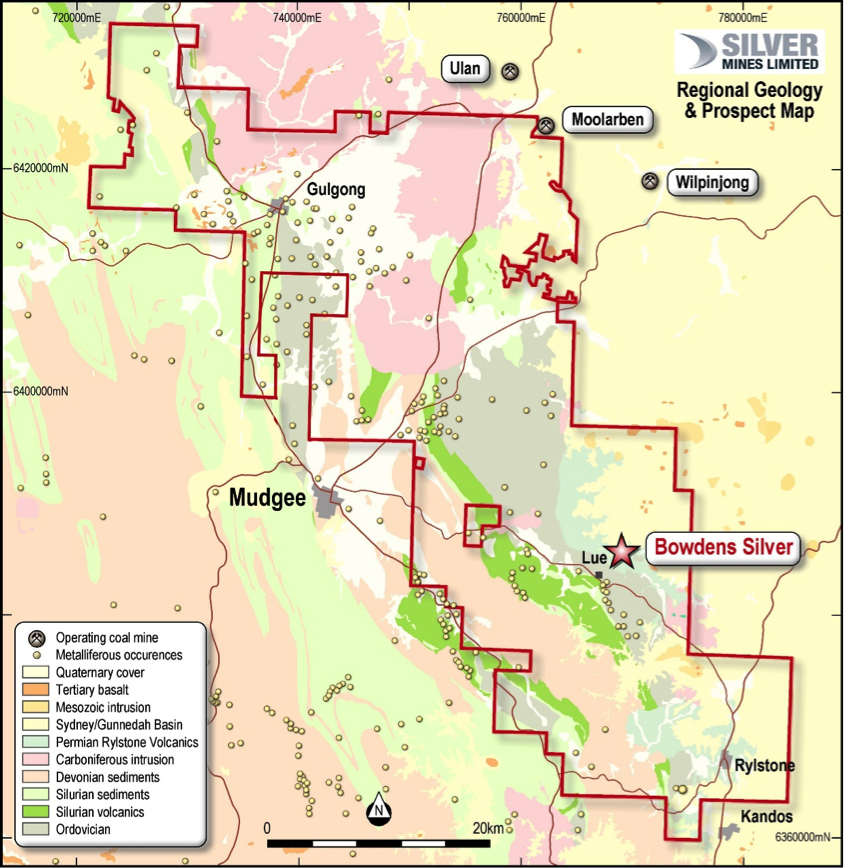
Bowdens Regional Geology
The resource defined thus far covers an area of approximately 113 hectares, as shown in the following diagrams.
The majority of the Bowdens silver-lead-zinc mineralisation is hosted within the Rylstone Volcanics where it occurs as a tabular, flat-lying to gently north dipping zone sub-parallel to stratigraphy. The style of mineralisation varies between rock types; generally, fracture controlled and veined within the welded tuff, veined and locally disseminated in the crystal tuff and mainly disseminated in the upper volcanic breccias. The highest-grade silver mineralisation, located in the northeast of the deposit, is generally intimately associated with steeply dipping, narrow, fracture fill veins. Colloform textured carbonate base-metal veining is also noted within the welded and crystal tuff.
 Bowdens Silver Deposit Geology

Bowdens Silver Deposit, geological section, Local grid 10,550mN

Bowdens Silver Deposit, Silver Equivalent Grade x Thickness Plan
Exploration drilling within the Project site early in 2018 has provided a platform to both significantly extend the Bundarra Deeps zone in the north of the deposit and to provide valuable geological data to allow exploration to be directed towards the source mineralisation.
Drilling of an Induced Polarisation (IP) chargeability target associated with the Bundarra Deeps base metal mineralised zone located at depth beneath the Bowdens Silver deposit recently intersected mineralisation demonstrating the existence of a significant hydrothermal system at Bowdens.
The intersection of felsic to dacitic porphyry dykes and sills, interpreted to be extensions of a larger intrusion is highly promising as such magmatic intrusions are often associated with epithermal systems around the world.
It is hoped that ongoing exploration work may better define this system, enhancing and extending the Project (see ASX announcements 5 February 2018 and 19 February 2018).
Ore Reserve and Mineral Resource
The Bowdens Ore Reserve is estimated at 29.9 million tonnes at 69.0 g/t silver, 0.44% zinc and 0.32% lead for 66.32 million ounces of silver, 130.8 kilotonnes of zinc and 95.3 kilotonnes of lead in contained metal.
The Ore Reserve estimate was prepared by mining engineering consultancy firm AMC Consultants Pty Ltd (AMC Consultants) and is based on the September 2017 Mineral Resource Estimate generated for Silver Mines by H & S Consultants Pty Ltd (H & S Consultants) (see ASX announcement 19 September 2017).
Measured and Indicated Mineral Resources were converted to Proved and Probable Ore Reserves respectively, subject to mine designs, modifying factors and economic evaluation. The Ore Reserve estimate for the Bowdens Silver Project as at May 2018 is outlined in the table below:
Bowdens Silver Deposit Ore Reserve
| Reserve Category | Tonnes | Reserve Grades | Contained Metal | ||||
| Ag | Zn | Pb | Ag Metal | Zn | Pb | ||
| (Mt) | (g/t) | (%) | (%) | Moz | (kt) | (kt) | |
| Proved | 28.6 | 69.75 | 0.44 | 0.32 | 64.05 | 125.11 | 91.43 |
| Probable | 1.3 | 53.15 | 0.43 | 0.29 | 2.27 | 5.74 | 3.91 |
| Total | 29.9 | 69.01 | 0.44 | 0.32 | 66.32 | 130.84 | 95.33 |
Notes
- Refer to ASX announcement 30 May 2018 for further details.
- Calculations have been rounded to the nearest 100,000 t, 0.1 g/t silver and 0.01% zinc and lead grades respectively. The Ore Reserve is reported by economic cut-off grade with appropriate consideration of modifying factors including costs, geotechnical considerations, mining and process recoveries and metal pricing.
The Bowdens Mineral Resource Estimate of September 2017 was completed by H & S Consultants using Multiple Indicator Kriging and the reporting is compliant with the 2012 JORC Code and Guidelines (see ASX announcement 19 September 2017). The Mineral Resource estimate for the Bowdens Silver Project as at September 2017 is outlined in the Table below:
Bowdens Silver Deposit Mineral Resource
| Category |
Tonnes (Mt) |
Silver Eq. (g/t) |
Silver (g/t) |
Zinc (%) |
Lead (% ) |
Million Ounces Silver |
Million Ounces Silver Eq. |
| Measured | 76 | 72 | 45 | 0.37 | 0.25 | 111 | 175 |
| Indicated | 29 | 59 | 31 | 0.38 | 0.25 | 29 | 55 |
| Inferred | 23 | 60 | 31 | 0.40 | 0.28 | 23 | 45 |
| Total | 128 | 67 | 40 | 0.38 | 0.26 | 163 | 275 |
Notes
- Refer to ASX announcement 19 September 2017 for full details.
- Bowdens’ silver equivalent: Ag Eq (g/t) = Ag (g/t) + 33.48*Pb (%) + 49.61*Zn (%) calculated from prices of US$20/oz silver, US$1.50/lb zinc, US$1.00/lb lead and metallurgical recoveries of 85% silver, 82% zinc and 83% lead estimated from test work commissioned by Silver Mines Limited.
- Bowdens Silver Mineral Resource Estimate is reported to a 30g/t Ag Eq cut off and extends from surface and is trimmed to 300 metres RL which is approximately 320 metres below surface representing a potential volume for open-pit optimisation models.
- In the Company’s opinion, the silver, zinc and lead included in the metal equivalent calculations have a reasonable potential to be recovered and sold.
- Variability of summation may occur due to rounding.
Bowdens Silver Deposit Mineral Resource Estimate by Cut-Off Grade
| Cut-off g/t Ag Eq. |
Tonnes (Mt) |
Silver Eq. (g/t) |
Silver (g/t) |
Zinc (%) |
Lead (%) |
Million Ounces Silver |
Million Ounces Silver Eq. |
| 0 | 397.2 | 30.7 | 17.6 | 0.18 | 0.12 | 225 | 392 |
| 10 | 261.7 | 43.7 | 25.2 | 0.26 | 0.17 | 212 | 368 |
| 20 | 185.2 | 54.6 | 31.7 | 0.32 | 0.21 | 189 | 325 |
| 30 | 127.9 | 66.8 | 39.6 | 0.38 | 0.26 | 163 | 275 |
| 40 | 89.2 | 79.7 | 48.6 | 0.43 | 0.29 | 139 | 229 |
| 50 | 63.6 | 92.8 | 58.4 | 0.47 | 0.33 | 119 | 190 |
| 60 | 46.1 | 106.3 | 69.1 | 0.51 | 0.36 | 102 | 158 |
| 70 | 33.7 | 120.8 | 80.9 | 0.54 | 0.39 | 87 | 131 |
| 80 | 25.1 | 135.5 | 93.4 | 0.57 | 0.42 | 75 | 109 |
| 90 | 19.2 | 149.9 | 105.6 | 0.59 | 0.45 | 65 | 93 |
| 100 | 15.1 | 163.7 | 117.5 | 0.62 | 0.47 | 57 | 80 |
| 120 | 9.6 | 192.3 | 141.4 | 0.67 | 0.53 | 44 | 59 |
Notes
- Refer to ASX announcement 19 September 2017 for full details.
The Bowdens MIK Mineral Resource model was developed by H & S Consultants. The model is a non-linear recoverable-type model incorporating proportional tonnages and grades above cut-off for both silver equivalent grade (Ag Eq) and silver (Ag), while also incorporating linear ordinary kriged panel estimates for lead (Pb), zinc (Zn), total sulphur (S), arsenic (As), antimony (Sb), manganese (Mn), cadmium (Cd), copper (Cu), and vanadium (V). The MIK resource model was created for a range of cut-off grades from 0 g/t to 120 g/t for both Ag and Ag Eq using 5 g/t to 10 g/t increments. The MIK recoverable model is designed to a selective mining unit (SMU) of 6.25 mE by 12.5 mN by 5 mRL and accounts for internal dilution within the mineralisation envelopes.
There has been considerable previous metallurgical test work completed for the Bowdens Silver deposit. Silver Mines commissioned additional metallurgical test work which has confirmed the results of previous work. Together this work has been reviewed by both GR Engineering and AMC Consultants to suggest that the recovery of silver, lead and zinc to concentrate via flotation is a viable processing option.
The Proved Ore Reserve estimate is based on Mineral Resources classified as Measured, after consideration of all mining, metallurgical, social, environmental, statutory and financial aspects of the Project. The Probable Ore Reserve estimate is based on Mineral Resources classified as Indicated, after consideration of all mining, metallurgical, social, environmental, statutory and financial aspects of the Project.
Geotechnical
Geotechnical assessment for the Feasibility Study was undertaken by AMC Consultants. The assessments include work undertaken for Kingsgate Consolidated, the immediate prior owner of the Project. AMC Consultants have determined that the design parameters established for the previous pit designs are still applicable to the Bowdens design.
Geotechnical data was collected and analysed and a provisional pit design divided into wall sectors has been constructed based on geotechnical domains including interpreted locations of eastern and western faults. Recommended design parameters were established for each wall sector.
The recommended slope angles by pit wall sector and primary geotechnical domain are shown in the table below and a plan showing the sectors below.
Table. Recommended slope angles by pit sector and primary geotechnical domain for 25 m bench height and 10
m berm width
| Location | Geotechnical Domain | ||||||
| Pit Area | Pit Wall Sector |
Ignimbrite | Crystal Tuff | Volcanic Breccia | |||
| BFA (°) |
IRA(1) (°) |
BFA (°) |
IRA (°) |
BFA (°) |
IRA (°) |
||
| North | North 1 | 65 | 49.1 | 65 | 49.1 | n/a(2) | |
| North 2 | 65 | 49.1 | n/a | 65 | 49.1 | ||
| North 3 | 65 | 49.1 | 65 | 49.1 | 65 | 49.1 | |
| East | East 1 | n/a | 75 | 56.3 | n/a | ||
| East 2 | n/a | 75 | 56.3 | n/a | |||
| South | South 1 | n/a | 65 | 49.1 | n/a | ||
| South 2 | 70 | 52.6 | 65 | 49.1 | n/a | ||
| South 3 | n/a | 75 | 56.3 | n/a | |||
| West | West 1 | 65 | 49.1 | 65 | 49.1 | n/a | |
| West 2 | 65 | 49.1 | 65 | 49.1 | n/a | ||
| West 3 | 65 | 49.1 | 65 | 49.1 | 65 | 49.1 | |
|
|||||||

Plan view of pit design illustrating pit wall sectors
Hydrogeological
Jacobs Group Australia Pty Ltd (Jacobs) were engaged to undertake a groundwater and dewatering assessment for the proposed Bowdens Silver Mine.
The mine dewatering requirements have been assessed through use of a numerical groundwater model developed for the Project. Model geometry was set consistent with resource modelling and the local geology, and hydraulic parameters have been informed by a series of hydraulic tests undertaken for the Project including, slug testing, packer testing and pumping tests.
Mine dewatering requirements are predicted to peak at the end of the Stage 3 mine development at up to 4.5 ML/day. The average predicted dewatering requirement over the life of mine is of the order of 2.15 ML/day, comprising 1.45 ML/day of groundwater inflow and 0.69 ML/day of rainfall runoff.

Modelled mine dewatering requirements over time
Mining
The MIK resource model announced in September 2017 was optimised by AMC Consultants using the Whittle Four-X software implementation of the Lerchs Grossman algorithm. The MIK recoverable model is designed to a selective mining unit (SMU) of 6.25 mE by 12.5 mN by 5 mRL and accounts for internal dilution within the mineralisation envelopes. The MIK model was modified to a mining model by creating sub cells for panels with vertical thicknesses defined by the Ag grade bin tonnage proportions and then assigning the corresponding Ag grade to the appropriate proportional tonnage sub cell.
The production profile tonnage as presented in the following table represents 100% of the Proved and Probable Ore Reserve. Proved Reserves represent 95.7% of the production profile while Probable Reserves represent 4.3% of the production profile.
The tables above show the Ore Reserve and Minerals Resource respectively. On a tonnage basis, Proved Reserves represent 37.6% of the Measured Resource while Probable Reserves represent 4.5% of the Indicated Resource. Inferred Resources were excluded from the economic evaluations and production targets.
Modifying parameters were agreed for metal prices, mining and treatment costs, administration charges, transport, smelting and refining charges. Metal recovery algorithms were incorporated into the optimisation based on the analysis of all of the metallurgical testwork programs.
Whittle 4X generates a series of concentric pit shells based on increments of the base (revenue factor 1.0) silver price. After analysing the output from this analysis, shell 25 (revenue factor 0.88) was selected as the final pit shell. Other shells were used to define five intermediate pit stages. A final pit design and stage designs (see figures below)were created. The cumulative ore and waste generated by each stage design was compared with the totals of the optimisation pit shell 25 and the total variance calculated as shown below.
Summary of pit contents to optimised pit shell
| Stage/Optimisation | Total Ore | Waste | Total Rock |
Strip Ratio W:O |
|||
| Tonnes (t) |
Ag (g/t) |
Pb (%) |
Zn (%) |
Tonnes (t) |
Tonnes (t) |
||
| Stage1 | 4,120,741 | 114.54 | 0.31 | 0.30 | 9,661,799 | 13,782,539 | 2.3 |
| Stage2 | 585,825 | 103.50 | 0.30 | 0.60 | 353,867 | 939,692 | 0.6 |
| Stage3 | 12,880,615 | 71.32 | 0.28 | 0.36 | 18,476,758 | 31,357,373 | 1.4 |
| Stage4 | 297,532 | 62.85 | 0.07 | 0.18 | 531,098 | 828,630 | 1.8 |
| Stage5 | 249,911 | 61.95 | 0.11 | 0.45 | 608,992 | 858,903 | 2.4 |
| Stage6 | 11,758,170 | 49.11 | 0.38 | 0.57 | 18,550,389 | 30,308,559 | 1.6 |
| Total pit design | 29,892,793 | 69.01 | 0.32 | 0.44 | 48,182,902 | 78,075,696 | 1.6 |
| Optimisation, pit shell 25 | 29,935,883 | 69.80 | 0.32 | 0.43 | 44,432,915 | 74,368,798 | 1.5 |
| Variance (%) | 0 | -1 | 0 | 1 | 8 | 5 | 9 |
The Minemax mine scheduling software was used to sequence these pits to maximise Net Present Value.
A waste rock emplacement (WRE) was designed to the east of the open pit, extending from natural surface to approximately 660 mAHD, constructed in 10m lifts with 10m construction berms and final slopes of between 14° and 18°.
Approximately 54% of the waste rock mined will be potentially acid forming (PAF) and will require encapsulation in the WRE by the use of non-acid forming rock (NAF). Other stockpiles will be formed to the south of the open pit, initially to act as a sound barrier but also to enable the management of NAF material to ensure its availability over time to encapsulate and cover the PAF material.
Low-grade ore will be generated in the course of mining and will be stockpiled to the east of the ROM pad and extend over the northern end of the WRE where it will extend from 660 mAHD to approximately 670 mAHD.
The combined WRE, NAF and low-grade ore stockpiles are capable of containing approximately 129% of the anticipated volume of all of these materials to be generated by the Project.

Bowdens Final Pit Design

Bowdens Staged Pit Designs
Schedule of Material Mined by Half Year
Schedule of Ore Feed to the Plant by Half-Year
 Bowdens Site Layout
Metallurgy and Process Flowsheet Development
A total of 13 metallurgical studies have been undertaken on samples from the Bowdens Deposit between 1998 and 2017. The most recent test work undertaken on behalf of Bowdens Silver by JK Tech Pty Ltd (JK Tech) served to confirm results obtained from the earlier testwork, whilst providing greater insight into the flotation response of the three primary lithologies represented within the deposit.
A total of 12 diamond drill holes were drilled to obtain metallurgical samples for comminution and flotation testwork. Uniaxial compressive strengths (UCS) ranged from as low as 14 MPa to as high as 136 MPa. Crusher work index was in a fairly tight range from approximately 8 kWh/t to around 12 kWh/t whilst Bond Ball Mill Work index varied from a low of 10.6 kWh/t to a high of 24.1 kWh/t. SMC testwork, used to determine the suitability of a SAG Mill, resulted in A x b values ranging from 32 to 96.9, which indicate the material is suitable for use with a SAG Mill.
Both batch and locked cycle flotation tests have been undertaken during the various metallurgical testwork programs. From these data a series of grade recovery curves have been developed that predict the recovery of each metal into their respective concentrates based on their respective head grades. The four formulas are as follows:
- Silver recovery into Lead Concentrate: 29.159ln(x) – 55.955 (capped at 80%)
- Silver recovery into Zinc Concentrate: -10.52ln(x) + 56.027 (capped at 20%, hard floor at 5%)
- Lead recovery into Lead Concentrate: 13.81ln(x) + 98.594 (capped at 90%)
- Zinc recovery into Zinc Concentrate: 20.055ln(x) + 98.298 (capped at 90%)
Note: In each formula, x refers to the head grade of the metal whose recovery is being determined.
Average Life of Mine recoveries for the Project are as follows:
- Silver recovery into lead concentrate – 69.0%
- Silver recovery into zinc concentrate – 10.7%
- Zinc recovery into zinc concentrate – 82.5%
- Led recovery into lead concentrate – 83.1%.
These grade recovery curves have been incorporated into the financial model for the Project.
The JK Tech testwork also sought to investigate alternative depressants for zinc and pyrite in the lead circuit. Sodium cyanide is ubiquitously used in the differential flotation of lead and zinc concentrates throughout the world, including at sites in New South Wales. Only sodium sulphide showed some potential as a depressant, however, it resulted in lower silver recovery and is not considered a viable replacement. Average weak acid dissociable (WAD) cyanide levels in the tailings were 6.5 mg/L for nearly eight times lower than the cyanide code level of 50 mg/L, which has proven safe for wildlife. A destruction plant is also being considered.
The analysis by GR Engineering of all the test work undertaken on the Project to date resulted in the defining of the process flow sheet (see below)that comprises a conventional single stage crushing, with an intermediate crushed ore stockpile feeding to a SAG Mill in open circuit with a ball mill operating in closed-circuit with a cyclone cluster to produce a P80particle size of 106 µm. The cyclone overflow will flow to a conditioning tank and then the lead recovery flotation circuit, which incorporates a re-grind mill between the rougher and cleaner stages that will produce a product with a P80of 20 µm. The lead circuit tailings will feed to the zinc circuit conditioning tank and then to the zinc flotation circuit, which also incorporates a re-grind mill between the rougher and cleaner stages that will produce a product with a P80of 20 µm. The final tails will be thickened before being pumped to the tailings storage facility. Lead and zinc concentrate slurries will pass to their respective thickeners before being pumped to a vertical plate filter press to dewater the slurry and produce a filter cake. The filter cake will discharge from the filter press and be loaded into two tonne bulk bags, which will then be loaded into shipping containers for transport to the smelters.
 Process Block Flow Diagram
Process Plant and Production
The process plant is to be located to the north of the open pit as shown above.
Site selection considered the site topography and environmental constraints such as noise, light spill and visual impact. The Feasibility Study assumes an Engineering, Procurement and Construction Management (EPC) approach to the construction of a plant using all new equipment.
The ROM pad is located to the south of the processing plant with the crusher located on the western side of the ROM pad. A conveyor takes the crushed ore to a crushed ore stockpile located to the north of the crusher. Feeders beneath the crushed ore stockpile feed onto a conveyor that discharges into the SAG Mill. The slurry moves northwards to the flotation cells, with concentrate and tailings moving northwards again to the thickening and filtration section of the plant. Concentrate filter cake is bagged in this area whilst the tailings are thickened prior to pumping to the tailings storage facility.
Tailings Storage Facility
ATC Williams Pty Ltd (ATC Williams) were engaged to undertake the design of the Tailings Storage Facility (TSF) for the Project. The design has been based on an open-cut operation with a life of mine (LOM) tonnage of 30 million tonnes and a throughput of two million tonnes per annum.
The TSF will be a down-valley storage facility located to the west of the pit and plant. Thickened tailings will be discharged at three locations from the head of the bifurcated valleys forming the TSF impoundment. The decant pond sits against the embankment at the south-west side of the TSF.
The 56 metre high TSF embankment will be constructed of a combination of rock and earth fill in three stages to reduce upfront capital costs. The starter embankment will provide three years of storage, with the Stage 2 filling in five years and Stage 3 a further eight years.
The decant water accumulating within the TSF will be recycled and utilised for processing.
Regular inspections will be made of the TSF facility and an annual audit will be carried out by an appointed Dams Engineer. Every second year the audit by the Dams Engineer will be comprehensive commencing one year after the start of filling.
Closure and rehabilitation studies have also been undertaken.
Project Infrastructure
The supporting infrastructure required for development of the Bowdens Silver Project will include the following site infrastructure works:
- Access roads;
- Internal access roads and tracks;
- Bulk earthworks for the process plant site and infrastructure that includes the internal roads, ponds, explosive magazine storage and mine service areas. Activities will include clearing all required areas, installations including culverts, box cuts, back fill, hard stands, dams, drains, catchments, services trenching and water storage ponds;
- Communications system;
- Transportable buildings including offices, change rooms, crib rooms and ablutions;
- Steel-framed buildings including workshops, warehouse and storage;
- Fuel storage and distribution facility;
- Power supply;
- Power reticulation across the project site;
- Site fencing and security;
- Process plant security;
- Water supply including raw water for processing and potable supplies;
- Waste water treatment; and
- Wheel wash system for public road-based vehicles.
With respect to the Project power supply, the preferred option involves a connection to the 132 kV busbar at the Ilford substation, approximately 40 kilometres of 132 kV transmission line will be constructed to the Project site and a 132/11 kV substation installed on site.
Open pit dewatering and stormwater harvesting are inadequate to meet the water requirements of the Project. Along with environmental considerations, the Company has determined that water for initial plant start-up and ongoing volumes will be supplied from external sources via a pipeline from the Ulan coalfields.
A major double circuit transmission line currently crosses the Project site at the western edge of the pit and will need to be relocated in Year 3 of operations. The proposed 4.3 kilometres diversion will be constructed wholly on land owned by Bowdens Silver. This relocation will ensure that there will be sufficient clearance to avoid any risk of damage from pit blasting activities.
Health, Environment and Social
The Application Area is dominated by the north-south oriented western, central and eastern Ridges (see figure below), separated by small valleys. Elevations range from approximately 770 metres AHD to 580 metres. The creeks between these ridges (Price Creek and Blackmans Gully) join Hawkins Creek at the south-eastern end of the proposed waste rock emplacement.
Lawsons Creek and Hawkins Creek flow east to west along the eastern and southern boundaries of the Mine Site. They join approximately 1 kilometres southeast of the Application Area, and Lawsons Creek joins the Cudgegong River near Mudgee, ultimately flowing into Burrendong Dam and the Macquarie River near Wellington.
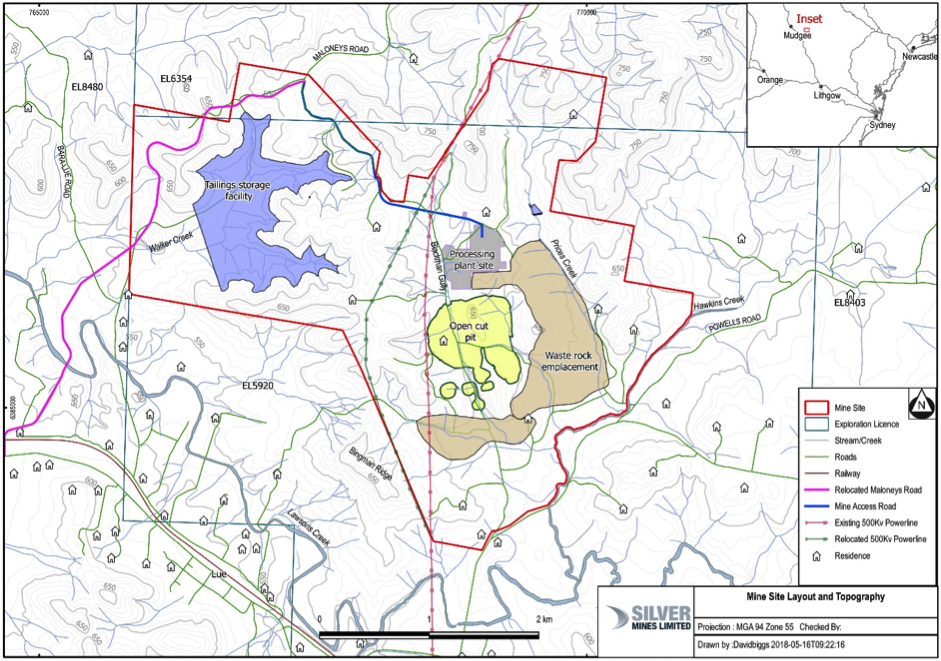 Mine Site Topography, Infrastructure and Indicative Mining Lease
The Project area has a warm temperate climate. Mean maximum temperatures range from 30.7°C in January to 14.3°C in July. Mean minimum temperatures range from 15.9°C in January to 1.3°C in July.
Mudgee’s mean annual rainfall of 672 mm is distributed relatively evenly throughout the year, ranging from 35.1 mm in April to 81.5 mm in December.
Wind speed and direction in the Project area show two distinct profiles. Within the Mine Site, a dominant northeasterly flow occurs, with less significant winds from the southwest to northwest quadrant. In Lue village, southwest of the Mine Site, a well-defined northwest-southeast aligned air flow occurs.
Principal land uses in the area are grazing of cattle and sheep. Rural residential and hobby farm properties are also present in the region.
The Company has engaged RW Corkery & Co Pty Limited (RWC) to coordinate and compile the Environmental Impact Statement (EIS). Specialist consultants have been engaged in all disciplines relevant to the Project. The EIS specialists include:
EIS Specialist Consultants
| Environmental Impact Statement Specialists | |
| EIS Management | RW Corkery & Co. Pty Limited |
| Noise, Vibration & Blasting | SLR Consulting Australian Pty Ltd |
| Visibility | Richard Lamb & Assoc. |
| Air Quality | Ramboll Environ Australia Pty Ltd |
| Terrestrial Ecology | EnviroKey Pty Ltd |
| Aquatic Ecology | Cardno (NSW/ACT) Pty Ltd |
| Soils and Land Capability | McKenzie Soil Management Pty Ltd |
| Site Access | Barnson Pty Ltd |
| Transport | The Transport Planning Partnership |
| Health Risk and Lead Management | Environmental Risk Sciences Pty Limited |
| Aboriginal and Cultural Heritage | Landskape |
| Surface Water | WRM Water and Environment |
| Groundwater | Jacobs Group (Australia) Pty Limited |
| Social Impact | Umwelt (Australia) Pty Limited |
| Economic Impact | Gillespie Economics |
Various environmental baseline surveys have been conducted and will be used to inform the EIS being prepared for the Project. Most data collection and field work components for all EIS disciplines have been completed or are nearing completion. Modelling for ground and surface hydrology, air quality and noise are mostly complete. As at the date of the Feasibility Study, all relevant discipline reporting is advanced and no issues detrimental to the Project have been identified.
A Human Health Risk Assessment (HHRA) is being conducted by Environmental Risk Sciences Pty Limited (EnRisks) for the purposes of the EIS. When considering potential health impacts within any community, the HHRA will consider the whole population as well as specific sensitive or vulnerable groups within the population.
A comprehensive Social Impact Assessment (SIA) is in preparation and has included analysis of the 2016 Census data and interviews with landholders and residents within the region to identify perceived Project issues, impacts, benefits and costs.
Aboriginal cultural heritage and non-aboriginal heritage sites have been recorded in and adjacent to the Mine Site area. The heritage sites located within the Mine Site have been assessed as not being of high scientific or cultural significance.
It is recognised that a range of mandatory post-approval documentation will be required as a result of the approval documents issued for the Mine. These will include the Mining Operations Plan and Rehabilitation Cost Estimate, Environmental Management Plan and Sub-Plans Annual Reporting.
Construction and Operations Strategy
As noted earlier, construction of the Project will be undertaken on an EPC basis. Under this methodology, Bowdens Silver will enter into a head contract with a suitably experienced contractor for a lump-sum price to carry out the construction. It is anticipated that the bulk of the site installation work for the process plant will be performed directly by the contractor. Specialist sub-contractors may be engaged on a lump sum basis to perform portions of the works requiring specialist equipment and experience.
Areas where specialist subcontractors may typically be employed include:
- Transport/freight services;
- Bulk earthworks;
- Concrete batching;
- Concrete installation;
- Large process tankage erection;
- Mill liner installation;
- High voltage overhead power line;
- Transportable buildings; and
- Steel-framed buildings.
During construction, when it is expected that a relatively high proportion of the workforce will not be resident in the area, accommodation will be provided by Bowdens Silver utilising existing accommodation facilities within the local region.
Mining development will commence 12 months ahead of anticipated commissioning of the plant and will entail the clearing and stockpiling of vegetation for re-spreading during rehabilitation, removal and stockpiling of topsoil from the Stage 1 open pit and Waste Rock Emplacement (WRE) and the establishment of initial mining benches. Noise mitigation structures such as bunds and the outer face of the WRE will be established during this period. It is anticipated that mining would only occur during daytime hours during the first six months of operation, until the pit had advanced to the third bench below the pit crest.
Construction personnel is estimated to total approximately 185 while operating personnel upon mine development is expected to total approximately 160. This is in addition to exploration and farm management personnel of approximately 20.
Marketing and Product Transport
Analysis of the marketability of Bowdens Silver Project silver/lead and zinc concentrates was conducted as part of the Feasibility Study. In summary, the result was a broad acceptance of the products, with no major issues relating to deleterious elements. Several parties were interested in the high-silver/lead concentrate and zinc concentrate.
The expected specification of the silver/lead concentrate is approximately 10,800 g/t silver and 62% lead, whilst the zinc/silver concentrate is expected to grade approximately 1000 g/t silver and 59% zinc.
The review has considered primarily offshore markets, however the Nyrstar Port Pirie smelting facilities in South Australia is a likely local purchaser. This facility has recently undertaken a major smelter rebuild.
As detailed elsewhere, both concentrate products will be bagged on site and transported in sealed shipping containers to their respective smelter destinations.
If the Nyrstar smelter at Port Pirie is the ultimate destination for the silver/lead concentrate, then this will be transported by truck to the railhead at Bathurst or Parkes and from there by rail to Port Pirie.
The zinc concentrate, likely destined for an overseas smelter, will be transported by truck to the container terminal at Port Botany for shipping.
Arsenic, antimony and fluorine were determined to be at levels in the silver/lead concentrate that would likely trigger penalties from smelters. The aggregate penalty for these elements is estimated at A$26.42 per dry tonne of concentrate. Manganese is the only element present in the zinc concentrate likely to attract a penalty. The penalty is estimated at A$3.50 per dry tonne.
Operating Cost Estimate
The operating costs for the Project have been developed in accordance with GR Engineering and AMC’s standards for cost estimation. The operating cost is expressed in Australian dollars and is exclusive of Goods and Services Tax (GST). It is based on costs prevailing in the Australian minerals industry for the fourth quarter of 2017.
The operating cost has been estimated at an average of A$44.85 per tonne of ore treated. The costs, broken down by category have been presented below.
Operating Costs (Real LOM)
| Cost Centre | LOM Amount A$’M | A$ /t feed |
| Mining | 382.7 | 12.80 |
| Grade Control | 25.6 | 0.86 |
| Rehabilitation | 39.4 | 1.32 |
| Processing | 542.6 | 18.15 |
| General & Administration | 98.7 | 3.3 |
| TC/RCs | 155.5 | 5.20 |
| Shipping Costs | 38.8 | 1.3 |
| Royalties | 57.6 | 1.93 |
| Total Operating Costs | 1,340.8 | 44.85 |
Capital Cost Estimate
The Project Capital Cost Estimate developed for the Feasibility Study is based upon an EPC approach for the process plant and infrastructure. The mining pre-production capital costs are excluded from this estimate but included elsewhere in the Feasibility Study.
The estimate includes all the costs associated with process engineering, design engineering, drafting, procurement, construction and commissioning of the process facility and associated infrastructure, mining services establishment, first fills of plant reagents and consumables, and spare parts to design, procure, construct and commission all of the facilities required to establish the Project.
The estimate is based upon preliminary engineering, quantity take-offs, budget price quotations for major equipment and bulk commodities. Unit rates for installation were based on market enquiries specific to the Project and benchmarked to those achieved recently on similar projects undertaken in the Australian minerals processing industry.
The estimate pricing was obtained predominantly during fourth quarter 2017 (4Q17) and is in Australian dollars (A$). Where pricing was received in a foreign currency, it was converted to A$ at the foreign exchange rates set at 4Q17. The estimate accuracy is +/-15%.
Summary of Capital and Sustaining Capital Costs
| Area |
Amount A$M |
| Mining Capex (incl. Dewatering & Mobilisation) | 4.5 |
| Plant | 62.6 |
| Tailings Storage Facility | 22.0 |
| Roads | 8.5 |
| Water | 12.7 |
| Buildings | 9.8 |
| Power | 38.7 |
| Vehicles | 4.0 |
| First Fill | 3.6 |
| EPCM | 42.0 |
| Owners Capex | 10.3 |
| Communications | 3.2 |
| Capitalised Operating Costs | 24.2 |
| Total Initial Capital | 246.0 |
| Sustaining Capital (LOM) | 53.9 |
Financial Evaluation and Sensitivity Analysis
The financial model for the economic evaluation of the Bowdens Feasibility Study utilises the discounted cashflow methodology and is based on parameters and costs supplied by the Company and its various technical consultants. Key financial metrics are calculated on both a pre- and post-tax basis.
The financial model is constructed on a nominal basis to ensure the correct treatment of depreciation, tax and tax losses and a half-yearly periodicity is used to ensure that the build-up of pre-production drawdowns and working capital is properly reflected. The base currency of the model is Australian dollars and an interest/inflation rate of 2.5% is assumed. Given that silver, zinc and lead are sold on international markets in US dollars the model captures revenues in USD and converts to AUD. Where real pricing is used in the model a 2.5% rate of USD inflation is applied. A starting exchange rate of 0.75 is used for AUD/USD.
Forecast metal pricing was based on consensus forecasts obtained by the Company in late 2017 and was sourced from a range of Australian and internationally renowned financial institutions. Initial silver prices assumed for the model were: CY20 = US$21.50 /oz, CY21 = US$22.00 /oz, CY22 = US$22.50 /oz. A zinc price of US$1.25 /lb was used and a lead price of US$1.00 /lb.
Construction is assumed to commence in January 2020 and be completed in June 2021, with first ore being fed to the plant in July 2021.
Life of Mine (LOM) Project Metrics
| Physical Metrics | Unit | Value |
| Production Life | Years | 16 |
| Ore Mined | Mt | 29.9 |
| Waste Mined | Mt | 48.2 |
| W:O Strip Ratio | x | 1.6 |
| Ag Recovered in Concentrate | Moz | 52.91 |
| Zn Recovered in Concentrate | kt | 108.0 |
| Pb Recovered in Concentrate | kt | 79.3 |
| Financial Metrics | AUD M | USD M |
| Revenue | 1,899.5 | 1,424.7 |
| Operating Expenses | 1,340.8 | 1,005.6 |
| Operating Margin | 558.7 | 419.0 |
| Undiscounted Cashflow before Tax | 257.7 | 193.3 |
| Undiscounted Cashflow after Tax | 155.7 | 116.7 |
| Project NPV (Pre-Tax) | 143.9 | 107.9 |
| Project NPV (Post Tax) | 70.6 | 52.9 |
| Project IRR (Pre-Tax): Nominal | 20.8% | |
| Project IRR (Post Tax): Nominal | 14.6% | |
| Capital Costs | AUD M | USD M |
| Initial | 246.0 | 184.5 |
| LOM Sustaining | 53.9 | 40.4 |
| Unit Costs (Ag Basis) | AUD/oz | USD/oz |
| C1 Costs | 15.47 | 11.60 |
| All in Sustaining Cost (AISC) | 17.25 | 12.94 |
Cumulative Production by Metal
Cumulative Revenue by Metal
Silver Mines has undertaken a range of consultations and conducted analysis on varying financing options for the Project. Financial institutions from Australia, North American and Europe who have expressed interest in financing the Project have included speciality groups involved in general project finance and debt provisioning. Hybrid financing options have also been analysed and include financing opportunities with speciality commodity streaming and royalty groups in North America and offtake and financing options with smelting groups in Europe and Asia. In addition, detailed discussions have also been undertaken with equity and quasi-equity groups primarily out of Australia and Europe. Consultations with regards to financing are typically subject to due diligence and securing mutually acceptable terms. The financial model has been prepared on an ungeared basis and has not considered commodity or foreign exchange instruments that may improve the financial outcomes.
Sensitivity analysis was conducted on the Project against the following variables:
- Silver, zinc and lead prices together;
- Silver price;
- Capital and sustaining capital costs;
- Overall operating costs;
- Mining operating costs;
- Plant operating costs;
- Downstream operating costs (freight and smelting).
The results in the table below show that the Project is most sensitive to a combined move in the three metals prices, followed by a move in silver price alone or overall operating cost and then capital. In general, the project’s NPV is about 60%-80% as sensitive to changes in operating costs as it is to all prices together and about 20% as sensitive to changes in capex as to price. The project is less sensitive to downstream costs, given the Project’s reasonable access to smelting and port facilities.
The following table demonstrates a range of NPV outcomes utilising varying assumption parameters.
Sensitivity Analysis
| Sensitivity Analysis (AUD M) NPV5 After Tax | Movement | |||||||
| -30% | -20% | -10% | Base Case | +10% | +20% | +30% | ||
| Silver, Lead & Zinc Prices | (217.78) | (113.39) | (17.27) | 70.58 | 155.12 | 239.30 | 323.45 | |
| Silver Price | (128.35) | (59.01) | 7.72 | 70.58 | 132.90 | 195.00 | 257.04 | |
| Overall Opex | 246.49 | 188.01 | 129.47 | 70.58 | 9.97 | (58.33) | (127.04) | |
| Capex (incl. Sustaining.) | 131.80 | 111.41 | 91.00 | 70.58 | 50.15 | 29.70 | 9.19 | |
| Mining Opex | 137.54 | 115.31 | 92.99 | 70.58 | 48.07 | 25.37 | 1.63 | |
| Plant Opex | 155.45 | 127.27 | 99.01 | 70.58 | 41.76 | 11.92 | (21.20) | |
| Downstream Opex | 95.30 | 87.08 | 78.84 | 70.58 | 62.31 | 53.99 | 45.64 | |
Permitting and Approvals
A range of Commonwealth and New South Wales legislation and State, regional and local planning instruments apply to the Project. These items of legislation and statutory instruments have been reviewed to identify any environmental aspects requiring consideration in the EIS. In addition, the Secretary’s Environmental Assessment Requirements (SEARs), issued by the Department of Planning and Environment (DPE) on 23rdDecember 2016 and updated on 15thAugust 2017, identified a number of guideline documents to be referenced/reviewed during the preparation of the EIS. The application and relevance of these planning instruments related to specific environmental issues associated with the Project will be addressed in the EIS and the relevant specialist consultant assessments.
The relevant legislation may be summarised as follows:
- Commonwealth Legislation:
- Native Title Act 1993
- Environmental Protection and Biodiversity Conservation Act 1999
- National Greenhouse and Energy Reporting At 2007
- New South Wales Legislation:
- Environmental Planning and Assessment Act 1979
- Mining Act 1992
- Protection of the Environment Operations Act 1997
- Biodiversity Conservation Act 2016
- Water Management Act 2000
- Roads Act 1993
- Explosives Act 2003.
The Project is a “State Significant Development”, having a capital investment value of greater than $30 million. The Development Application (DA) for the Project will be accompanied by a comprehensive EIS supported by a range of specialist consultant studies. The EIS will also exhaustively address the specific requirements of the SEARs. An application for a Mining Lease will be submitted with the DA.
Project Implementation Schedule
The critical path for the Project implementation is the specification, procurement, installation and commissioning of the mills, for which the order for commencement of supply is scheduled to be placed within the first four weeks of the Project after award or at such other time as may be deemed suitable. The duration of this critical path, from contract award to the commencement of ore commissioning, is estimated at approximately 80 weeks.
Forward Looking Statements
The above may contain forward looking information and statements that are subject to risk factors associated with mineral exploration, mining, processing and production businesses.
It is believed that the expectations reflected in these statements are reasonable however such information is not a guarantee of future performance and involve unknown risks and uncertainties, as well as other factors, many of which are beyond the control of the Company. Actual results and developments may differ materially from those expressed or implied by these forward-looking statements depending on a variety of factors including but not limited to price fluctuations, commodity demand, currency fluctuations, drilling and production results, Mineral Resource and Ore Reserve estimations, loss of market, competition, environmental risks, physical risks, legislative, fiscal and regulatory changes, economic and financial market conditions, political risks, project delay or advancement, approvals and cost estimates.
Forward-looking information and statements, including projections, forecasts and estimates, are provided as a general guide only and should not be relied on as an indication or guarantee of future performance. No representation or warranty, expressed or implied, is made or given by or on behalf of the Company, any of the Company’s directors, or any other person as to the accuracy or completeness or fairness of the information or opinions contained in this website and no responsibility or liability is accepted by any of them for such information or opinions or for any errors, omissions, misstatements, negligent or otherwise, or for any communication written or otherwise, contained or referred to in this website.

A substantial amount of technical work has already been completed by previous owners of the project.


